Science literacy

This has been floating around for a while, and I’ve been meaning to mention it. So here goes.

Science Literacy — American Adults ‘Flunk’ Basic Science, Says Survey

  • Only 53% of adults know how long it takes for the Earth to revolve around the Sun.
  • Only 59% of adults know that the earliest humans and dinosaurs did not live at the same time.
  • Only 47% of adults can roughly approximate the percent of the Earth’s surface that is covered with water.
  • Only 21% of adults answered all three questions correctly.

We see these surveys from time to time, and I don’t know whether to be skeptical. I can see missing #3 (the correct answer is about 70%, and they accepted 65–75%), but #1 is hard to believe. Here’s the actual question with its choices:

Question #1
How long does it take for the Earth to go around the Sun?

  • One day
  • One week
  • One month
  • One year
  • Not sure

Half of all adults got this wrong? Really? We’re in deep, deep shit. One can only hope that it’s the same folks who don’t get around to voting.

Difficult-to-Pronounce Things are Judged to Be More Risky

Another in a series of reasons we should think twice before entrusting our decisions to … people.

Abstract

Low processing fluency fosters the impression that a stimulus is unfamiliar, which in turn results in perceptions of higher risk, independent of whether the risk is desirable or undesirable. In Studies 1 and 2, ostensible food additives were rated as more harmful when their names were difficult to pronounce than when their names were easy to pronounce; mediation analyses indicated that this effect was mediated by the perceived novelty of the substance. In Study 3, amusement-park rides were rated as more likely to make one sick (an undesirable risk) and also as more exciting and adventurous (a desirable risk) when their names were difficult to pronounce than when their names were easy to pronounce.

via Bruce Schneier

Pessimistic voters

Actually, this story has nothing to do with voting, at least not directly. But elections have been on our minds recently, and my first reaction was: these are the people who are electing our leaders.

A group of French researchers report the results of a survey. The premise is trivially simple:

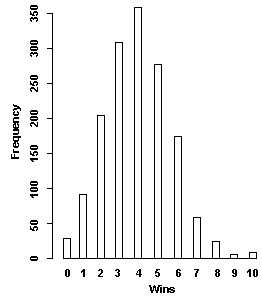
In this paper, we analyze the answers of a sample of 1,540 individuals to the following question “Imagine that a coin will be ‡ipped 10 times. Each time, if heads, you win 10€. How many times do you think that you will win?”

The average answer? About 3.9, with 75% of the respondents saying less than 5.

D64E076D-E227-4D64-AE71-AA42415B53C6.jpg

The details are a little more subtle, but no more reassuring.

…the mean value for the number of times (out of ten) the individual announces he is going to win is equal to 3.925 or the mean subjective probability of gain is equal to 0.3925. Moreover, 75% of the individuals give an answer below 5. This result is quite striking and in favour of the existence of a behavioral bias towards pessimism in individual beliefs. The same results have been obtained on a sample of undergraduate and graduate students in management and mathematics (236 individuals). Besides, notice that when individuals are asked about the number of times (out of ten) they think “heads” will occur without associated gains, the average answer is 5 as expected and 90% of the answers are exactly 5. This would mean that our results are not related to numerical skills or to knowledge of elementary probability.

via Kevin Drum

Intent of the voter?

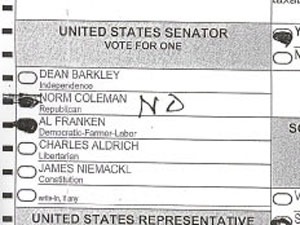
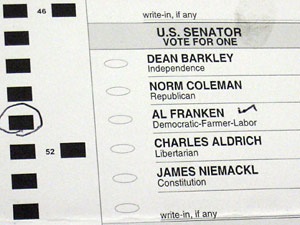
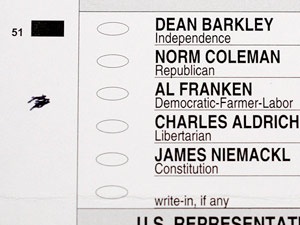
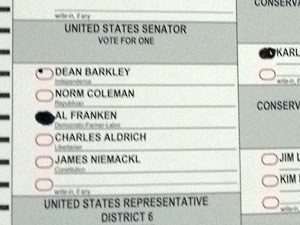
Minnesota Public Radio has a few photos of disputed ballots in the Franken-Coleman recount, and asks voters to weigh in on how each voter’s intent should be decided.

Some are fairly obvious:

BE1BEBBC-2EF6-49F4-9E01-723AD59CB9F7.jpg

This one requires a little more interpretation, but again the voter intent is clear enough to me (though not to an automatic counting machine):

C9D55BE2-80E9-4321-8D62-E5B71BF13F56.jpg

Here we have a pair of somewhat similar cases. I’d count the first as a vote for Franken (though I’d want to see the rest of the ballot before I decided for sure). The second, though, not so much.

7707AE6F-1B75-4AFB-B64F-142892D47B21.jpg 3A5A6CC1-974C-4730-BD86-A5F8B41995A4.jpg

Have a look for yourself. I’m partial to paper ballots, myself, but here we have an election that will very likely be decided by some very close decisions on interpreting the not-quite-clear intent of a handful of sloppy voters. Some of these could be caught by a machine reader at the polling place, but that’s no help for absentee ballots, and absentee voters can’t get a replacement ballot quite so easily as precinct voters.

Drawing the line at a different point (moving from “intent of the voter” to a more strict requirement to, say, fill in one and only one bubble) doesn’t really help; it just pushes the gray area to another place. And machine marking of paper ballots might help on election day, but it does nothing for absentees.

On the whole, the Minnesota system strikes me as a good one.

“To put it succinctly, we win.”

Congratulations to Sam Wang and the Princeton Election Consortium.

The Electoral College
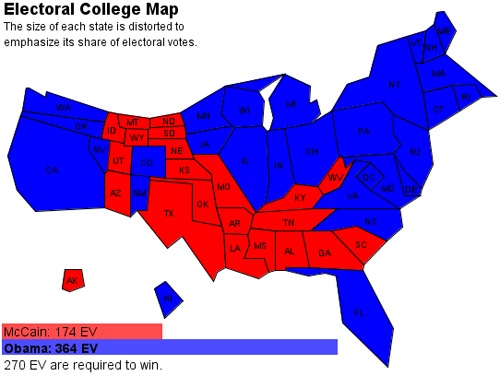
Outcome: Obama 365 EV, McCain 173. The map (NE 2 not shown):

65286379-CCA4-4C1A-8ADC-0D8687A47A3F.jpg

FiveThirtyEight: 348.5 EV. Error: 18.5 EV.
Electoral-vote.com: 353 EV. Error: 12 EV.
The last-day Median EV Estimator for Obama: 352 EV. Error: 13 EV.
Our prediction: Obama 364 EV, McCain 174. Error:1 EV.
Closest: Princeton Election Consortium.

Individual state wins
FiveThirtyEight: 50 out of 51 correct, Indiana missed.
Electoral-vote.com averages: 49 correct, 1 incorrect (Missouri), 1 tie (Indiana).
Our prediction: 50 correct, Indiana missed.
Closest: Tie between the Princeton Election Consortium and FiveThirtyEight.

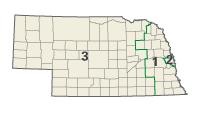
Obama wins Nebraska CD-2

Most states allocate their Electoral College electors on a statewide winner-take-all basis. The exceptions are Maine and Nebraska, which give an elector to the winner of each congressional district (the other two electors go to the state wide winner). It’s not quite (or even close to) proportional representation, as evidenced by the fact that neither state has ever split their EC delegation.

NebraskaThat appears to change as of this election, with the Omaha World-Herald reporting that Obama has won in NE CD-2, which contains Omaha itself. That leaves Obama with 365 electoral votes; only Missouri (11 votes) remains to be decided.

How much is your vote worth?

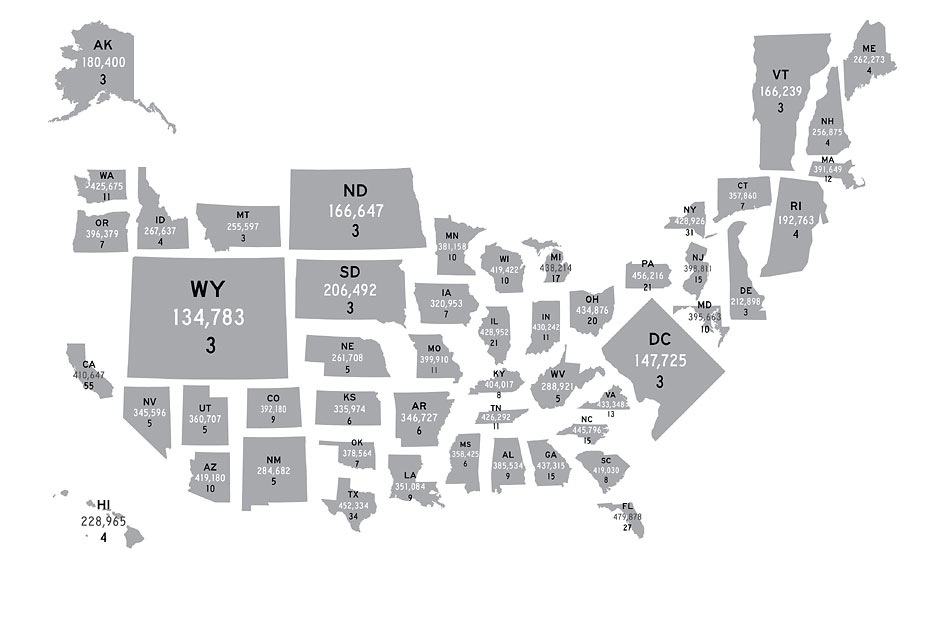
That was the heading for this NY Times chart:

This map shows each state re-sized in proportion to the relative influence of the individual voters who live there. The numbers indicate the total delegates to the Electoral College from each state, and how many eligible voters a single delegate from each state represents.

vote weight

The accompanying article describes the usual small-state Electoral College bias, but goes on from there:

But there is a second, less obvious distortion to the “one person, one vote” principle. Seats in the House of Representatives are apportioned according to the number of residents in a given state, not the number of eligible voters. And many residents — children, noncitizens and, in many states, prisoners and felons — do not have the right to vote.

In House races, 10 eligible voters in California, a state with many residents who cannot vote, represent 16 people in the voting booth. In New York and New Jersey, 10 enfranchised residents stand for themselves and five others. (And given that only 60 percent of eligible voters turn out at the polls, the actual figures are even starker.) Of all the states, Vermont comes the closest to the one person, one vote standard. Ten Vermont residents represent 12 people.

The state-to-state difference is dramatic. In fact, though, for many of us, the actual situation is even worse. Voters in California (like me) or in Wyoming, despite the big difference in voting weight as shown in the above map, have approximately zero chance of influencing the outcome of a presidential election, simply because our electors are allocated on a winner-take-all basis, and our states very reliably go for one party or the other.

(A possible fix for this is the National Popular Vote project, but the main subject of this post is the nifty graphic.)

California Proposition 11: Yes, but…

Proposition 11: Redistricting. Constitutional Amendment and Statute.

Creates 14-member redistricting commission responsible for drawing new district lines for State Senate, Assembly, and Board of Equalization districts. Requires State Auditor to randomly select commission members from voter applicant pool to create a commission with five members from each of the two largest political parties, and four members unaffiliated with either political party. Requires nine votes to approve final district maps. Establishes standards for drawing new lines, including respecting the geographic integrity of neighborhoods and encouraging geographic compactness. Permits State Legislature to draw lines for congressional districts subject to these standards. Summary of estimate by Legislative Analyst and Director of Finance of fiscal impact on state and local government: Probably no significant increase in state redistricting costs. (Initiative 07-0077.) (Full Text)

I’ll be voting yes on Prop 11, but with no particular enthusiasm. Peter Schrag, writing in the Sacramento Bee, gets it pretty much right:

California’s Proposition 11, which would take the power of drawing legislative districts out of the hands of the politicians who are most vitally interested in it, won’t do much to reduce partisanship in Sacramento or solve most of California’s other problems.

But let’s pass the thing so we can get this old saw off the agenda and attend to some reforms that might make a real difference.

My list of reforms (proportional representation and public campaign financing are at the top) isn’t the same as Schrag’s, but we come to the same conclusion. I’ll vote for Prop 11, but I won’t lose any sleep if it fails.

The Psychological Consequences of Money

I’ve had this post waiting in draft form for quite a while (the article in question appeared almost two years ago). It seems apropos to my last post, so no more procrastinating (on this post, anyway).

In a fascinating paper published at the end of 2006 in Science, Kathleen Vohs et al report on nine experiments regarding the influence of money on our behavior. The rather dry abstract doesn’t begin to do justice to the content.

Money has been said to change people’s motivation (mainly for the better) and their behavior toward others (mainly for the worse). The results of nine experiments suggest that money brings about a self-sufficient orientation in which people prefer to be free of dependency and dependents. Reminders of money, relative to nonmoney reminders, led to reduced requests for help and reduced helpfulness toward others. Relative to participants primed with neutral concepts, participants primed with money preferred to play alone, work alone, and put more physical distance between themselves and a new acquaintance.

The article itself is, I think, available only to AAAS members; one of the experiments will give a better idea of what the rest of the article is about.

In Experiment 5, we wanted to give money-primed participants a helping opportunity that required no skill or expertise, given that the help that was needed in the two previous experiments may have been perceived as requiring knowledge or special skill to enact. The opportunity to help in the current experiment was quite easy and obvious, in that it involved helping a person who spilled a box of pencils.

Participants were randomly assigned to one of three conditions that were manipulated in two steps. Each participant first played the board game Monopoly with a confederate (who was blind to the participant’s condition) posing as another participant. After 7 min, the game was cleared except for differing amounts of play money. Participants in the high-money condition were left with $4000, which is a large amount of Monopoly money. Participants in the low-money condition were left with $200. Control condition participants were left with no money. For high- and low-money participants, the play money remained in view for the second part of the manipulation. At this step, participants were asked to imagine a future with abundant finances (high money), with strained finances (low money), or their plans for tomorrow (control).

Next, a staged accident provided the opportunity to help. A new confederate (who was blind to the participant’s priming condition) walked across the laboratory holding a folder of papers and a box of pencils, and spilled the pencils in front of the participant. The number of pencils picked up (out of 27 total) was the measure of helpfulness.

The result? “Even though gathering pencils was an action that all participants could perform, participants reminded of financial wealth were unhelpful.” And this was the consistent result across nine rather imaginative experiments.

In one of the experiments, all it took to create the money-primed selfish bias was exposure to a poster of currency on the wall (controls saw a poster of a seascape or a flower garden). In another, subjects “happened” to be in front of a computer screen while filling out a questionnaire.

Participants in the money condition saw a screensaver depicting various denominations of currency floating underwater . Participants in the fish condition saw a screensaver with fish swimming underwater. Participants in the no-screensaver condition saw a blank screen.

As Sharif Abdullah says, “we are lined up at the same trough”; we can’t help ourselves.

What might prime us in the other direction, I wonder?

The disappearing Bradley effect

Sam Wang again, moving from the effects of cell phones to the effect of race on polls.

The disappearing Bradley effect:

A hot topic among polling nerds is the “Bradley effect,” which occurs when a non-white (usually black) candidate falls short of opinion polls on Election Day when he/she runs against a white candidate. For this reason it has been suggested that support for Obama might be overstated — a hidden bonus for John McCain. Now comes a large-scale empirical study by Harvard political scientist Dan Hopkins. He finds that since the mid-1990s, the Bradley effect has disappeared. His paper is a must-read.

Polling: the cell phone effect

Sam Wang of the Princeton Election Consortium estimates the cell phone effect at about 1%. What’s the cell phone effect? The general idea is that a) pollsters mostly don’t call cell phones, b) more and more people have only cellphones and are thus not included in polls, and c) those people may have systematically different political views than the rest of the population (for example, they might be younger, and younger voters might tend to favor one candidate over another).

The cell phone effect: about 1 percent

How much has cell phone usage affected the reliability of polls? The answer may surprise you: Depending on what pollsters do about it, not much at all. Obama’s support may be understated by as little as 1%.

The question of whether polls have systematic errors is a continuing one. In the recent polling news is a Pew Center study that hits hard on the question of cell phone users. According to the survey, failing to survey people who have cell phones but no landline leads to a net underestimate of Obama’s support relative to McCain. According to a previous Pew/AP survey, cell-onlys comprised nearly 13% of households at the end of 2006. Cell-onlys prefer Obama over McCain by 18-19% (compared with an even split in the landline sample). Uncorrected, this leads to an error of about 0.13*0.185 = 2.4% in the Obama-McCain margin. Clearly this is significant, which is the Pew Center’s conclusion.

Follow the link for quite a bit more.

Sucker bets, nontransitivity, and the Marquis de Condorcet

So, this came up yesterday as we were drinking a little bubbly before (or was it after?) a performance of All’s Well That Ends Well at Shakespeare Santa Cruz. It’s an apparent paradox that shows up in some kinds of voting methods as well. I say “apparent” because we’re merely fooled by our assumption that some non-transitive relationships are transitive.

What do we mean by a transitive relationship? Here’s and example. 5 is greater than 4; 4 is greater than 3; by transitivity, 5 is greater than 3.

Here’s the sucker-bet version of the problem in, I think, its simplest form. Suppose I have nine playing cards, A-9, ace low, and arrange them into three piles of three cards each. The game is that you pick a card from one pile, I pick one from a different pile, and high card wins. Our assumption of transitivity leads us to assume that there’s a “best pile”. For example, a pile with the 987 cards would always win. 

We can arrange the cards, though, so that no matter which pile you choose from, I can choose from a pile that gives me a 5/9 chance of winning. I won’t win every time, but in the long run I’ll clean up. Here are the piles:

A68  357  249

The A68 pile beats 357 five times out of nine; likewise 357 beats 249; and 249 beats A68!

(This particular example comes from The Math Factor; recommended.)

For the voting version of this “paradox”, let’s turn to Wikipedia.

The voting paradox (also known as Condorcet’s paradox or the paradox of voting) is a situation noted by the Marquis de Condorcet in the late 18th century, in which collective preferences can be cyclic (i.e. not transitive), even if the preferences of individual voters are not. This is paradoxical, because it means that majority wishes can be in conflict with each other. When this occurs, it is because the conflicting majorities are each made up of different groups of individuals. For example, suppose we have three candidates, A, B and C, and that there are three voters with preferences as follows (candidates being listed in decreasing order of preference):

Voter 1: A B C
Voter 2: B C A
Voter 3: C A B

If C is chosen as the winner, it can be argued that B should win instead, since two voters (1 and 2) prefer B to C and only one voter (3) prefers C to B. However, by the same argument A is preferred to B, and C is preferred to A, by a margin of two to one on each occasion. The requirement of majority rule then provides no clear winner.

Voting methods that use this kind of pairwise counting, sometimes called Condorcet methods, don’t always show these cycles, of course, but when they do the cycle must be broken in order to come up with a winner. In the example above, we have a strong tie; there’s no basis in the voter preferences to choose a winner, so we have to go beyond the ballots to pick the winner; drawing lots is one way. In most cases, though, there’s some other cycle-breaking method that gives us a winner based on some reasonable interpretation of voter preferences as shown by the ballots. Follow the Condorcet methods link to Wikipedia for examples.
Democracy by Other Means

Aidan Hartley in the NY TImes.

John Stuart Mill addresses this problem in Representative Government, sounding, to our ears, more than a little paternalistic. But surely it’s also true that elections are a necessary but not sufficient element of a democratic society.

Democracy by Other Means

Kenyan democracy has failed because ordinary people were encouraged to believe that the process in and of itself could bring change. So Kenya’s leaders — and often international observers — interpret democracy simply in terms of the ceremony of multiparty elections. Polls bestow legitimacy on politicians to pillage for five years until the next depressing cycle begins.

In the campaign rallies I attended, I saw no debate about policies, despite the country’s immense health, education, crime and poverty problems. The Big Men arrived by helicopter to address the voters in slums and forest clearings. When they spoke English for the Western news media’s benefit, they talked of human rights and democracy. But when they switched to local languages, it was pure venom and ethnic chauvinism. Praise-singers kowtowed to the candidates, who dozed, talked on their mobile phones and then waddled back to their helicopters, which blew dust into the faces of the poor on takeoff.

OpenSTV 1.1

OpenSTV 1.1 has been released.

OpenSTV is a Python-based program with a reasonable GUI for counting elections using a variety of STV and selected other rules. I’ve been participating in the project in a small way as a developer; so far I’ve worked mainly o Mac OS X support. Standalone versions of the program are available for OS X and Windows—no need to install Python, etc.

STV (which stands for “single transferable vote”) is a class of election methods that allow voters to rank their choices, and then produces (in multiple-seat elections) proportional results. The single-winner version of STV is known as instant-runoff voting (IRV) or the alternative vote (AV). STV is also known as ranked-choice or preferential voting.

I’ll be posting more about elections and voting; in the meantime, if you need to count an STV election, download a copy of OpenSTV and go to it.