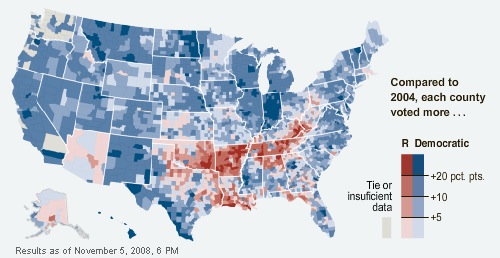
OK, yet another election graphic, NY Times via Sam Wang.
Keep in mind that this is the shift from 2004 to 2008 (no, Utah didn’t vote for Obama). There’s lots to notice, but the most dramatic shift is the dark red, where McCain-2008 did 20+ points better than Bush-2004.
Also of interest is support for the home-state advantage idea: look at Arizona, Alaska, Illinois, Massachusetts, Wyoming, and Delaware. North Carolina is an exception; it went more heavily for Obama despite not having a homeboy in the race this year. Texas is inconclusive.
