This chart is not seasonally adjusted, so it’s hard (impossible) to see month-to-month trends. But the annual trend is certainly dramatic. The crash starts in April 2006 and never looks back.
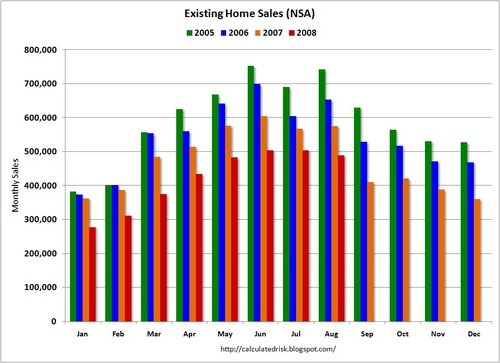
Calculated Risk via Barry Ritholtz
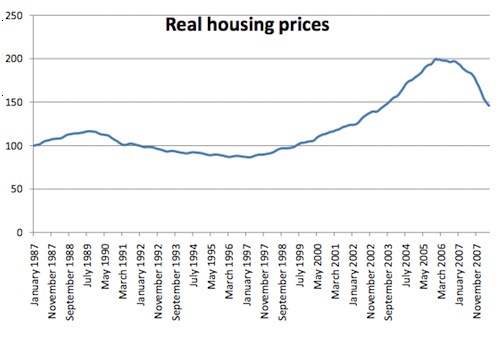
Update: here’s a companion graph (on a much longer time scale) of real housing prices from Matthew Yglesias. Not surprisingly, the price crash starts just about when the volume starts to drop.