Steve Benen:
National Review’s Victor Davis Hanson explained his rationale yesterday for denying evidence of global warming.
I just spent a few days in the Sierra in May during freezing cold temperatures and snow; a week ago it was quite cool and raining in New York; each time I have passed through Phoenix this spring it seemed unseasonably cool; and just gave a talk on the Russian River and about froze. Meanwhile the grapes look about ten days behind due to unseasonably cool temperatures. Any empiricist would be worried, as Newsweek once was, about global cooling. Will the planet boil, if we slow down a bit, review the science and dissenting views, and consider the wisdom in a recession of allotting nearly a trillion dollars to changing our very way of life (while the Chinese absorb market share)?
It’s items like these that help explain why our political discourse is so routinely stunted. If the left and right disagreed on how best to address policy challenges, that would at least open the door to constructive dialog. But we’re still stuck in a political environment in which prominent conservative voices at high-profile conservative outlets a) don’t recognize the difference between climate and weather; b) find meaningless anecdotes compelling evidence of global trends; and c) are entirely comfortable delaying necessary solutions while trying to continue an already-completed debate. …
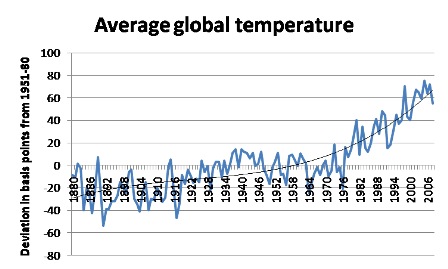
Which is by way of context for this graph via Paul Krugman.
One of the favorite arguments of climate-change deniers is “but it was warmer in the late 90s.” In fact, the odds are good that I’ll get that argument from George Will on This Weak tomorrow. I basically know the answer: temperature is a noisy time series, so if you pick and choose your dates over a short time span you can usually make whatever case you want. That’s why you need to look at longer trends and do some statistical analysis. But I thought that it would be a good thing to look at the data myself.
So here’s average annual global temperature since 1880, shown as .01 degrees C deviation from the 1951-80 average.
Update: one more thing, also via Krugman.